Utilisation Rate: The Number That Decides If Your Rental Business Works
Every rental business owner knows the feeling of walking through an equipment yard on a Tuesday afternoon and looking at rows of parked machinery. Idle equipment does not just take up physical space it bleeds capital. Every machine sitting unrented accumulates depreciation, incurs insurance costs, and ties up funds that could drive growth elsewhere.
Managing a successful fleet requires knowing exactly how hard your assets are working. That is where the rental utilisation rate comes in. It is not simply an operational metric for fleet managers to monitor in passing; it is the fundamental health indicator of your entire business model. Understanding how to calculate, interpret, and optimize this single number determines whether your company scales profitably or quietly runs out of cash.
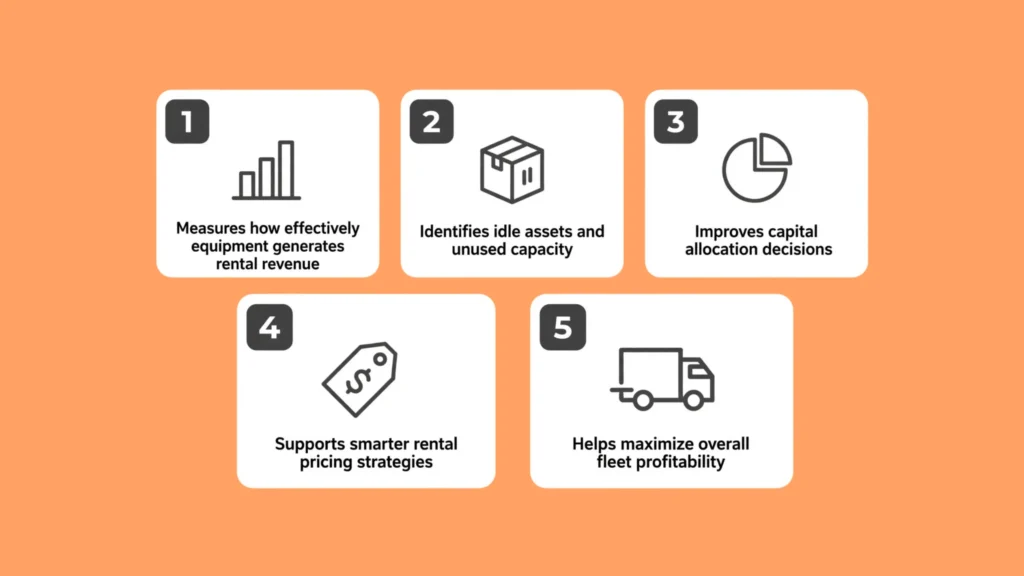
The rental utilisation rate measures how effectively a business deploys its fleet to generate revenue over a given period. It evaluates equipment efficiency through two distinct lenses: time utilisation (the percentage of total available time assets spend rented) and dollar utilisation (the financial yield generated relative to asset acquisition costs). Balancing both metrics allows operators to optimize inventory mix, eliminate idle machinery, adjust pricing strategies, and maximize overall business profitability.
Key Takeaways
The Core Metric: Rental utilisation rate measures how effectively equipment generates revenue versus sitting idle in inventory.
Dual Metrics Matter: Tracking time utilisation alongside dollar utilisation reveals hidden operational inefficiencies that single metrics miss.
Financial Impact: Low utilisation drains capital through depreciation, maintenance, and storage without generating offset cash flow.
Actionable Optimization: Optimizing maintenance schedules, dynamic pricing, and inventory mix directly improves fleet returns.
What Is Rental Utilisation Rate and Why Does It Matter?
At its core, utilisation measures how much value you extract from the assets you own. In the rental industry, capital expenditure is heavy, and inventory represents your largest upfront investment. If those assets remain idle in a warehouse, your business absorbs fixed costs without corresponding income.
High-performing rental companies do not simply buy more inventory when demand rises. They evaluate asset efficiency first. By continuously analyzing performance, operators determine whether existing assets generate maximum return before committing capital to expand. Operational analysis platforms like reliablestartup.com emphasize that scaling fleet size without understanding underlying performance metrics often compounds existing operational inefficiencies rather than solving them.
Tracking utilisation helps businesses solve three critical operational challenges:
For businesses operating an equipment rental business, understanding fleet utilisation is essential for making informed inventory investments, controlling operating costs, and maximizing long-term profitability.
Capital Allocation: Deciding when to acquire new inventory and when to dispose of underperforming equipment.
Pricing Strategy: Identifying whether low revenue stems from low rental activity or underpriced rates.
Maintenance Planning: Scheduling preventative service during natural operational downtime rather than peak rental periods.
Time Utilisation vs. Dollar Utilisation: The Dual Approach
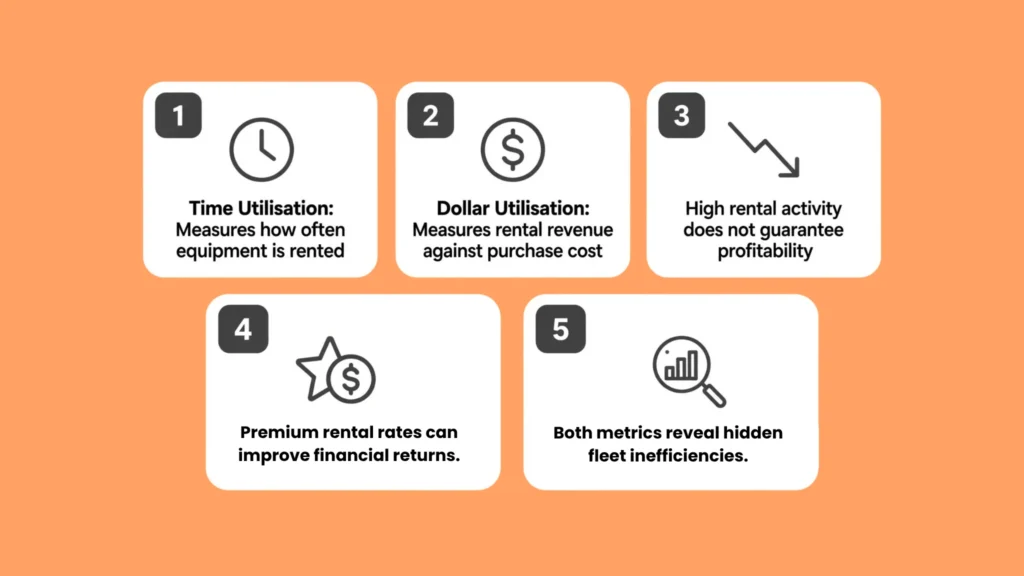
Evaluating fleet health using a single percentage creates blind spots. A company might have machinery out on job sites 90% of the time, yet still struggle to turn a profit. To gain an accurate picture, rental operators must separate operational availability from financial yield.
Understanding Time Utilisation
Time utilisation measures total hours or days equipment actively earns daily rental income against total available calendar inventory. It answers a straightforward question: How often is your equipment out on hire? If you own 10 excavator units available for rent over a 30-day month (300 total available days), and those units are on customer sites for a combined 210 days, your time utilisation rate is 70%.
This metric highlights operational demand. High time utilisation indicates strong customer demand and efficient logistics. However, relying solely on time utilisation can be misleading. Discounting rental rates heavily to keep equipment moving inflates time utilisation while destroying profit margins.
Understanding Dollar Utilisation
Dollar utilisation, often called financial utilisation, evaluates annualized gross rental revenue generated against total original equipment purchase cost. It measures the financial yield of your inventory. If a piece of equipment costs $100,000 to purchase and generates $40,000 in gross rental revenue over a 12-month period, its dollar utilisation rate is 40%.
Dollar utilisation ensures that high operational activity translates into actual financial returns. An asset can have modest time utilisation but exceptional dollar utilisation if it commands premium rental pricing due to specialization or high market demand.
The Equipment Utilisation Formula and Calculating It
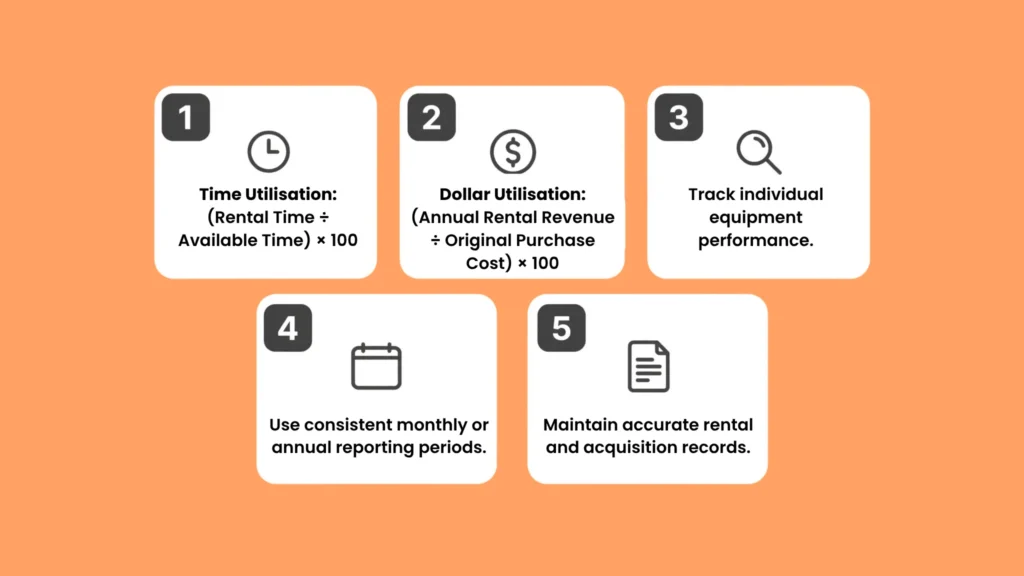
Calculating performance requires clear, consistent formulas applied across specified timeframes, whether weekly, monthly, or annually.
Formulas for Time and Dollar Metrics
To calculate time utilisation, divide the actual rental period by total available capacity and multiply by 100. Ensure total available hours account for planned maintenance downtime if you want an accurate measure of operational efficiency. To calculate dollar utilisation, divide annualized rental revenue by the asset’s original acquisition cost and multiply by 100.
Real-World Calculation Example
Consider two different assets in a construction rental fleet to see how this works in practice:
Asset A (Standard Scissor Lift): Purchased for $25,000. It spends 250 days out of 300 available days on rent at $100 per day. This yields a time utilisation of 83.3% and generates $25,000 in annual revenue, resulting in a dollar utilisation of 100%.
Asset B (Specialized Heavy Crane): Purchased for $200,000. It spends 90 days out of 300 available days on rent at $1,200 per day. This yields a time utilisation of 30.0% and generates $108,000 in annual revenue, resulting in a dollar utilisation of 54.0%.
Asset A achieves exceptional time utilisation, keeping logistics teams busy. Asset B shows lower time metrics but generates significant revenue relative to its cost structure. Analyzing both numbers provides clear guidance on fleet composition and capital allocation.
What Is a Good Utilisation Rate for Rental Businesses?
A common mistake among fleet managers is aiming for 100% time utilisation. While continuous equipment deployment sounds ideal, operating at complete capacity creates significant operational friction.
Operational Risks of 100% Utilisation
Maintenance backlogs build up because equipment continuously deployed in the field cannot undergo routine preventative maintenance, leading to sudden job-site breakdowns. Customer friction also increases because zero buffer inventory means turning away high-margin, short-notice requests from key clients. Logistical chaos follows as turnaround times between rentals become constrained, increasing transport and turn-in errors.
Industry Benchmark Targets
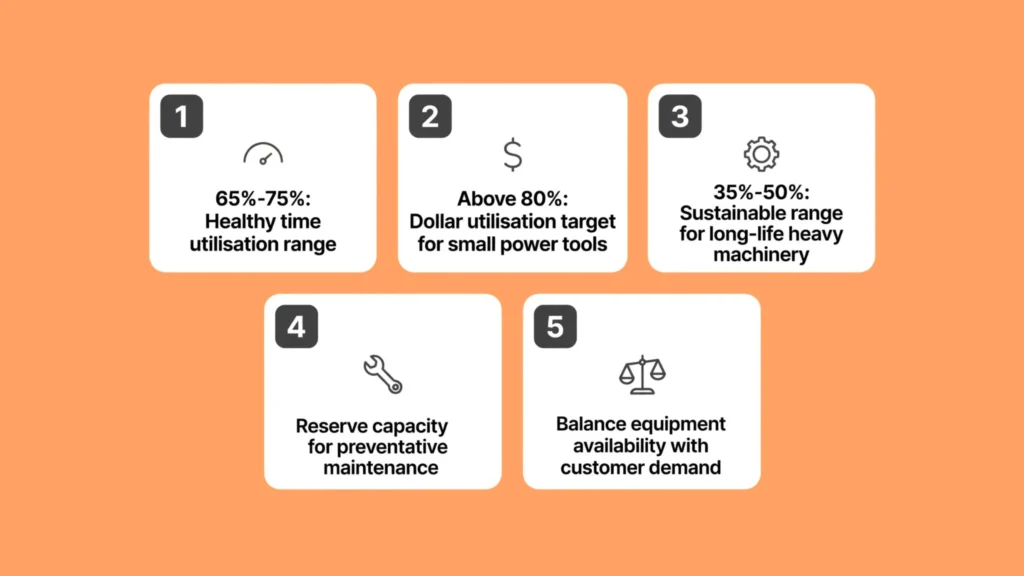
In most equipment rental categories, an average time utilisation rate between 65% and 75% represents a healthy operational balance. This range ensures high asset productivity while leaving sufficient buffer for preventative maintenance, repairs, and unexpected demand spikes.
For dollar utilisation, target benchmarks vary widely depending on asset life spans and maintenance demands. High-depreciation items like small power tools typically require dollar utilisation rates well above 80% to maintain profitability, whereas long-life heavy machinery often operates sustainably around 35% to 50%.
Causes of Low Utilisation (and How to Fix Them)

When equipment sits idle longer than anticipated, structural operational issues are usually responsible. Identifying these root causes is essential for restoring profitability.
Inventory Imbalance and Demand Misalignment
Stocking assets based on seasonal trends or gut feelings rather than customer demand data leads to inventory imbalance. You may experience stockouts on popular mid-sized equipment while specialized inventory sits untouched for months. The fix is to conduct quarterly portfolio reviews, sell off consistently underperforming assets, and reallocate that capital into high-demand equipment categories.
Maintenance Bottlenecks and Turnaround Delays
Equipment flagged for minor repairs often languishes in turnaround bays for weeks due to missing parts or disinvested shop workflows. Equipment stuck in repair bays reduces total available fleet capacity without earning revenue. Implementing preventative maintenance tracking software to schedule inspections during known low-demand periods helps resolve this. Streamlining parts ordering also shortens repair turnaround times.
Pricing Model Disconnects
If rental rates are set too high above local market standards without justified value additions, order volumes drop. Conversely, setting prices too low degrades dollar utilisation even if equipment stays continuously rented out.
Implementing tiered pricing structures and shifting from static rate sheets to dynamic market-aligned pricing helps stabilize baseline time utilisation through strategic discounts for longer contract commitments.
Analytical frameworks published by reliablestartup.com indicate that equipment rental firms implementing structured fleet audits routinely uncover 10% to 15% in hidden inventory capacity without acquiring a single new asset.
The Strategic Impact of Tracking Fleet Performance

Monitoring equipment efficiency shapes broader business strategy, directly influencing cash flow management, asset lifecycle decisions, and customer relationships.
Capital Expenditure and Fleet Lifecycles
A well-structured equipment rental business plan should also account for fleet utilisation targets, equipment depreciation, maintenance expenses, and projected rental revenue to support sustainable financial planning.
Preventive fleet maintenance enables scheduled service routines during seasonal lulls, reducing field breakdowns. Dynamic rental pricing maximizes revenue during peak demand cycles while protecting volume during off-peak windows.
Every machine has an optimal economic lifespan. Early in an asset’s life, maintenance costs are minimal and utilisation is generally high. As equipment ages, repair expenditures rise while market rental demand drops due to newer competitor offerings.
Tracking ongoing utilisation rates alongside accumulated maintenance costs reveals the exact inflection point where holding an asset transforms from profitable to loss-making. Fleet operators can then sell equipment into secondary markets while it retains resale value, reinvesting proceeds into modern inventory.
Financing and Business Valuation
Lenders and equity investors evaluating rental businesses examine fleet efficiency closely. A company generating strong revenue from a compact, highly utilized fleet presents a lower risk profile than a firm producing identical revenue from a massive, underutilized inventory pool. High financial yield demonstrates disciplined operational execution, enabling access to favorable financing terms.
Step-by-Step Guide to Optimizing Fleet Efficiency
Improving equipment returns requires structured execution across operations, sales, and logistics teams.
Operational Audit and Segmentation
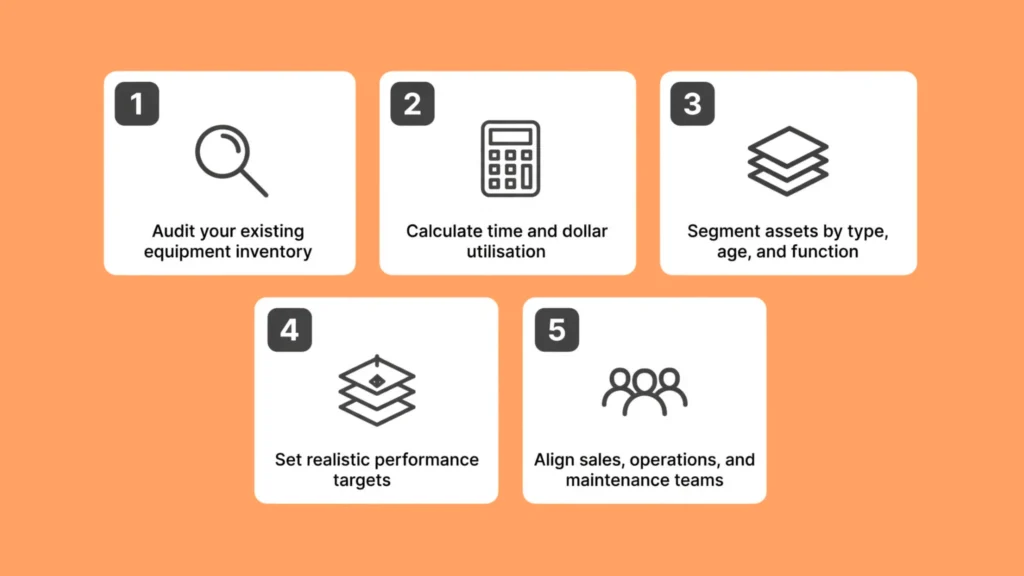
First, establish baseline metrics by auditing current inventory across every equipment category. Calculate separate time and dollar metrics for the preceding 12 months to establish accurate operational baselines.
Second, segment your inventory by asset class, grouping assets by type, age, and function. High-demand core inventory must be tracked separately from specialized, low-frequency equipment to avoid skewed averages. Third, set realistic target benchmarks for each equipment category rather than applying a blanket company-wide goal.
Tracking and Team Alignment
Fourth, integrate real-time tracking by utilizing modern telematics, IoT sensors, and equipment rental management software to monitor active equipment run-times, track availability, and improve fleet management accuracy.
Manual spreadsheets often introduce data lag and human entry errors. Fifth, align sales and operations by sharing utilisation reporting with sales teams. Direct promotional focus toward underutilized equipment categories to balance inventory flow throughout the year.
Modern management guidance from reliablestartup.com highlights that digital asset tracking reduces missing inventory losses while dramatically improving the accuracy of availability forecasts provided to field sales representatives.
Frequently Asked Questions (FAQs)
How often should a rental company calculate its utilisation rate?
Rental companies should monitor time utilisation on a weekly basis to manage short-term availability and fleet logistics. Dollar utilisation is best evaluated on a monthly and annual basis to assess capital efficiency, asset profitability, and fleet investment returns.
Can a rental business have high time utilisation but low profitability?
Yes. If rental rates are heavily discounted or operating costs such as maintenance and logistics are poorly controlled, equipment can spend significant time on job sites without generating positive net cash flow. This highlights why dollar utilisation must be tracked alongside time metrics.
How do telematics improve equipment utilisation tracking?
Telematics devices automatically log actual engine run hours, location data, and operational status in real time. This eliminates manual record-keeping errors, tracks true asset usage on customer job sites, and alerts operations teams when maintenance is due.
Is it better to rent out equipment long-term or short-term for better utilisation?
Long-term rentals provide stable, predictable time utilisation and lower logistics costs. Short-term rentals typically carry much higher daily rates, yielding better dollar utilisation. A balanced rental fleet combines both strategies to lock in baseline revenue while capturing peak short-term margins.
How does preventative maintenance affect fleet utilisation rates?
Scheduled preventative maintenance reduces unexpected job-site breakdowns, extending total asset longevity. While routine maintenance briefly reduces available time capacity in the short term, it prevents prolonged turnaround delays caused by major component failures, improving long-term fleet efficiency.
Conclusion
Your rental utilisation rate is fundamentally a reflection of operational discipline. Running a profitable rental business is not about owning the largest yard or holding the most inventory; it is about maximizing the value generated by every asset in your fleet.
By tracking both time utilisation and dollar utilisation, identifying the structural causes of fleet idle time, and making data-backed capital allocation decisions, you transform equipment management into a repeatable competitive advantage. Measure consistently, adjust operational strategies based on clear performance metrics, and build a fleet designed for sustained profitability.
About The Author