Food Cost Percentage and Menu Engineering in Plain Numbers
Running a profitable restaurant requires balancing culinary creativity with strict financial discipline. While outstanding menu items attract guests, controlling costs ensures long-term operational success. At the center of kitchen profitability is your food cost percentage—the direct relationship between the money spent on raw food inventory and the sales generated by serving those menu items.
When restaurant operators track their target food cost and combine that data with strategic menu engineering, managing a menu transforms from an unpredictable task into a systematic profit driver. Choosing the right food and beverage business models also helps entrepreneurs understand how different food operations affect production costs, pricing strategies, and long-term profitability.
Understanding how every ingredient contributes to your overall margin allows you to design offerings that satisfy customers while building a resilient food business.
This guide breaks down every critical component of plate cost calculation, overall financial formulas, target margins, and menu engineering matrix strategies using clear explanations and practical numbers.
What Is Food Cost Percentage and Why Does It Matter?
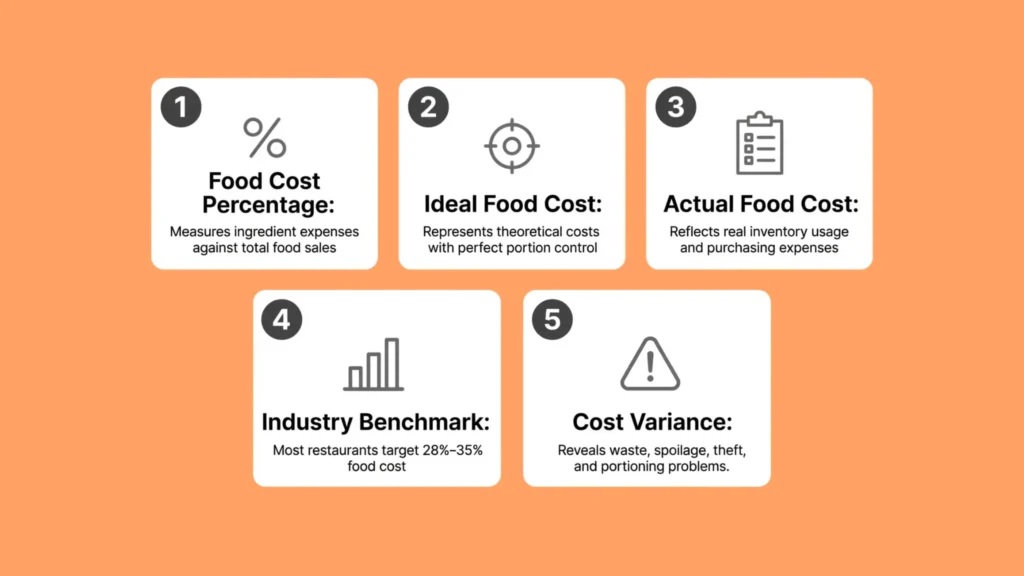
Food cost percentage measures the proportion of total revenue spent on purchasing raw food inventory. Expressed as a percentage of overall sales, this financial metric indicates how efficiently a commercial kitchen converts raw inventory into gross revenue.
Managing this ratio helps operators spot inventory losses early, set realistic menu prices, and maintain healthy profit margins. Understanding your numbers requires differentiating between theoretical performance and practical reality in daily kitchen operations.
Ideal vs. Actual Food Cost
Target Food Cost (Ideal Food Cost): The theoretical percentage derived from precise recipe calculations. This metric assumes perfect portion sizes, zero prep waste, zero spoilage, and no inventory theft.
Actual Food Cost: The real-world percentage calculated from actual inventory counts, supplier invoices, inventory adjustments, and total sales recorded over a specific operational timeframe.
The variance between your target food cost and actual food cost highlights internal operational issues. A significant gap points to problems like uncalibrated portion tools, improper cooking techniques, kitchen prep waste, undocumented spillage, unrecorded complimentary dishes, or theft.
Industry Food Cost Benchmarks
Food cost benchmarks fluctuate across different dining concepts, service models, and ingredient profiles. Standard industry targets typically align with the following ranges:
Overall Restaurant Food Cost Target: 28% to 35%
Steakhouses and Seafood Concepts: 32% to 40% (higher ingredient expenses offset by higher absolute dollar margins)
Pizzerias and Italian Restaurants: 20% to 28% (lower raw ingredient expenses driven by bulk items like flour, sauce, and pasta)
Coffee Shops and Bakeries: 15% to 25% (very low raw material costs relative to retail selling prices)
How to Calculate Food Cost Percentage?
Accurate inventory tracking relies on two primary calculation methods: evaluating overall operational performance over a defined time period and calculating itemized recipe costs for individual plates.
1. Overall Period Food Cost Formula
To determine your overall food cost percentage for a week, month, or quarter, you must audit physical inventory counts alongside purchasing records and POS sales data.
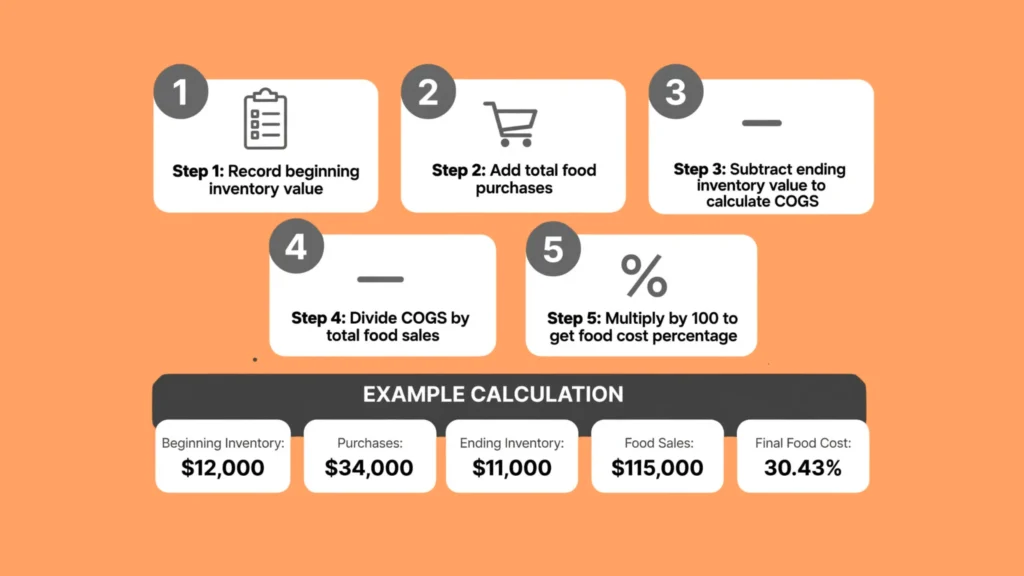
The step-by-step mathematical process involves adding your beginning inventory value to total inventory purchases made during the period, then subtracting the ending inventory value to establish your Cost of Goods Sold (COGS). Dividing COGS by total food sales and multiplying the result by 100 provides your operational food cost percentage.
Consider a practical monthly operational scenario:
Beginning Inventory Value: $12,000
Total Inventory Purchases: $34,000
Ending Inventory Value: $11,000
Total Recorded Food Sales: $115,000
First, establish the Cost of Goods Sold by taking $12,000 plus $34,000 minus $11,000, which equals $35,000 in total raw food expenditure.
Next, divide the $35,000 COGS by total food sales of $115,000 and multiply by 100. This calculation results in an actual food cost percentage of 30.43% for that operational month.
2. Plate Cost Calculation for Individual Recipes
Before pricing any item on your menu, complete a thorough plate cost calculation for every single recipe component, down to garnish portions and side dishes. Similar cost-control principles apply to meal preparation businesses, where standardized recipes and portion measurements help maintain consistent ingredient costs and predictable margins. Consider a standard recipe cost breakdown for a Gourmet Bacon Burger with Fries:
Ground Beef Patty (8 oz of 80/20 beef at $5.20 per pound): $2.60 item cost
Artisanal Brioche Bun ($7.20 per 12-pack): $0.60 item cost
Thick-Cut Applewood Bacon (2 slices from a $24.00 3-lb pack): $0.80 item cost
Aged Cheddar Cheese (1 slice from a $5.00 20-slice pack): $0.25 item cost
Lettuce, Tomato, Onion, and Sauce Portion (calculated bulk allocation): $0.45 item cost
Seasoned Potato Wedges (8 oz portion from a $20.00 20-lb bag): $0.50 item cost
Summing every component yields a total plate cost of $5.20 for the complete dish. If this gourmet burger sells to customers for $17.50, calculate the dish’s food cost percentage by dividing $5.20 by $17.50 and multiplying by 100, which yields 29.71%.
Setting Your Target Food Cost and Menu Pricing Strategy
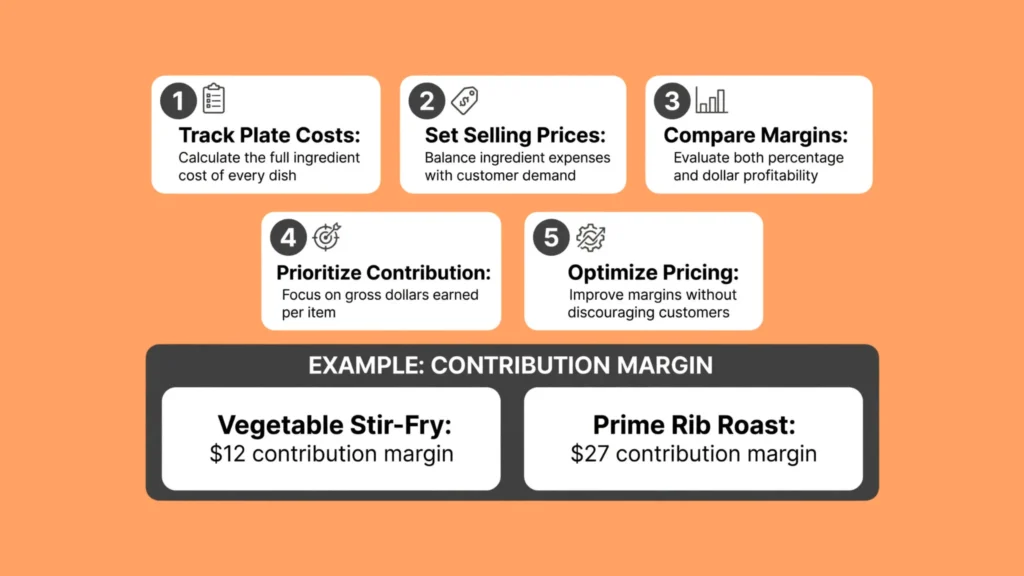
Relying exclusively on food cost percentage goals when setting retail prices can distort overall profitability. Long-term commercial success depends on maximizing contribution margin the remaining gross dollar amount left to pay for overhead expenses after paying for raw ingredients.
These financial principles are equally important in mobile food operations, where food and labor cost management plays a major role in maintaining sustainable profit margins. Calculate contribution margin by subtracting the raw plate cost from the retail selling price.
Comparing Percentage Efficiency and Gross Dollar Profit
Evaluating dishes strictly by food cost percentages can lead operators to misjudge which items generate true income. Comparing two distinct menu items illustrates this principle:
Item A (Vegetable Stir-Fry): Costs $3.00 to prepare and sells for $15.00. The item delivers an impressive 20% food cost percentage and generates a contribution margin of $12.00 per unit sold.
Item B (Prime Rib Roast): Costs $15.00 to prepare and sells for $42.00. The item carries a higher 35.71% food cost percentage but generates a contribution margin of $27.00 per unit sold.
While Item A maintains a superior percentage metric, Item B provides $15.00 more in gross revenue ($27.00 compared to $12.00) toward paying rent, utilities, insurance, and payroll. Successful menu design combines percentage controls with deliberate dollar contribution targets.
The Essentials of Menu Engineering
Menu engineering is the analytical process of categorizing menu items according to historical sales volume and individual gross contribution margin. Developed by researchers at Michigan State University, this evaluation framework helps operators optimize menu visual layouts, adjust pricing, and refine recipe selections. Evaluating sales performance requires placing every menu item into one of four distinct matrix categories.
The Four Menu Engineering Matrix Quadrants
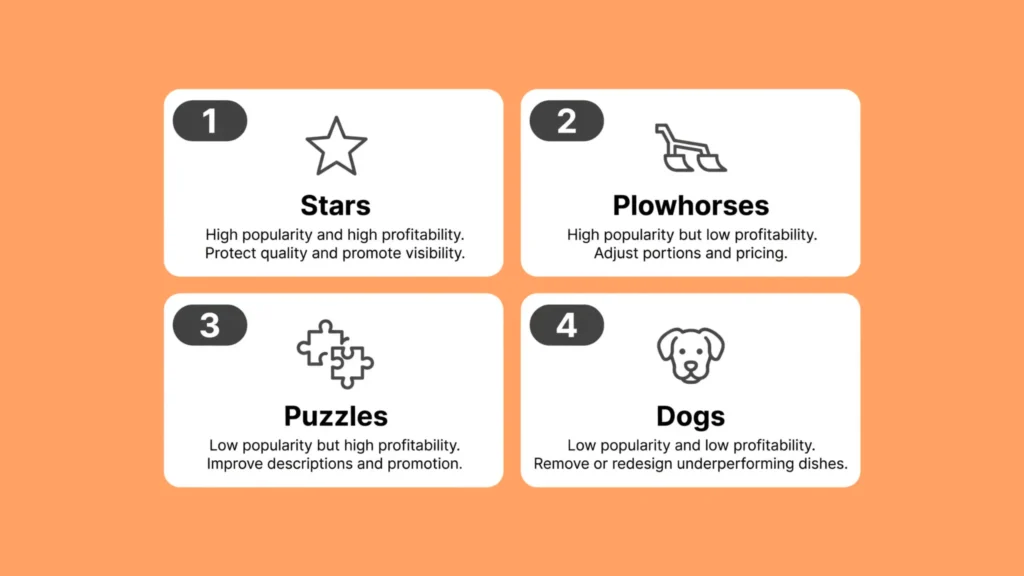
1. Stars (High Profitability, High Popularity)
Stars represent your top-performing items—dishes that customers order frequently and that generate exceptional dollar contribution margins.
Management Strategy: Protect consistency and product quality. Keep these dishes prominently featured in prime visual focus areas on your physical and digital menus. Avoid aggressive price increases that might disrupt sales momentum, and maintain strict recipe specifications.
2. Plowhorses (Low Profitability, High Popularity)
Plowhorses sell in high volume but deliver below-average dollar contribution margins, often due to expensive raw ingredients or modest selling prices.
Management Strategy: Work to improve contribution margins without damaging overall sales volume. Incrementally raise retail prices, review portion sizing, or re-engineer recipes by pairing high-cost ingredients with lower-cost accompaniments.
3. Puzzles (High Profitability, Low Popularity)
Puzzles offer strong contribution margins but fail to capture significant customer interest, resulting in low sales velocity.
Management Strategy: Investigate why sales remain low. Rewrite menu descriptions using appealing sensory language, reposition the item in high-visibility layout zones, train service staff to highlight the dish, or adjust the presentation to increase diner appeal.
4. Dogs (Low Profitability, Low Popularity)
Dogs record low sales volume and yield below-average contribution margins. These items consume valuable kitchen storage, create prep labor overhead, and slow down inventory turnover.
Management Strategy: Remove these items from your standard menu layout. Replace them with fresh, seasonal concepts or redesign the concept entirely to improve both popularity and profitability metrics.
Critical Factors Affecting Kitchen Margins
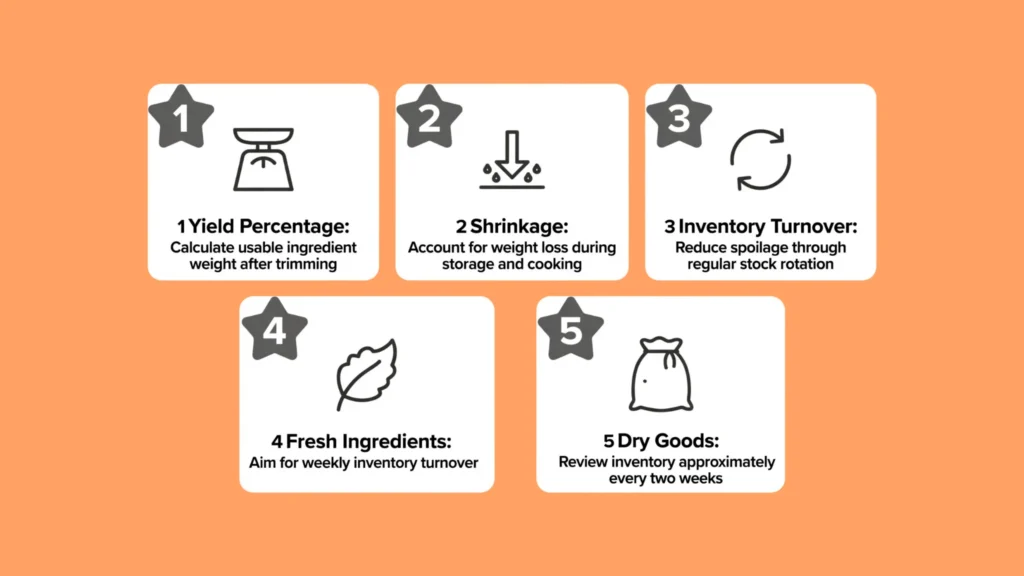
Managing inventory expenses requires attention to several operational variables that directly alter plate costs.
Yield Percentage and Shrinkage
Raw ingredients change weight and volume during storage, trimming, and cooking. Failing to incorporate true yield percentages skews recipe cost calculations.
For instance, purchasing a 10-pound whole beef tenderloin for $120.00 equates to an raw purchase price of $12.00 per pound. However, removing fat and silver skin yields 7.5 pounds of usable steak meat. Calculate the actual usable cost per pound by dividing the total purchase cost of $120.00 by 7.5 usable pounds, raising the true cost to $16.00 per pound.
Entrepreneurs planning specialized food operations should also account for equipment, refrigeration, and initial inventory when estimating their food business startup costs.
Managing Inventory Turnover
High inventory turnover rates protect capital and prevent inventory decay. Excess raw inventory sitting on storage shelves increases risks from spoilage, damage, and theft. Aim for a weekly inventory turnover cycle for fresh meats and produce, and a bi-weekly cycle for dry items and frozen storage.
Operational Best Practices for Food Cost Control
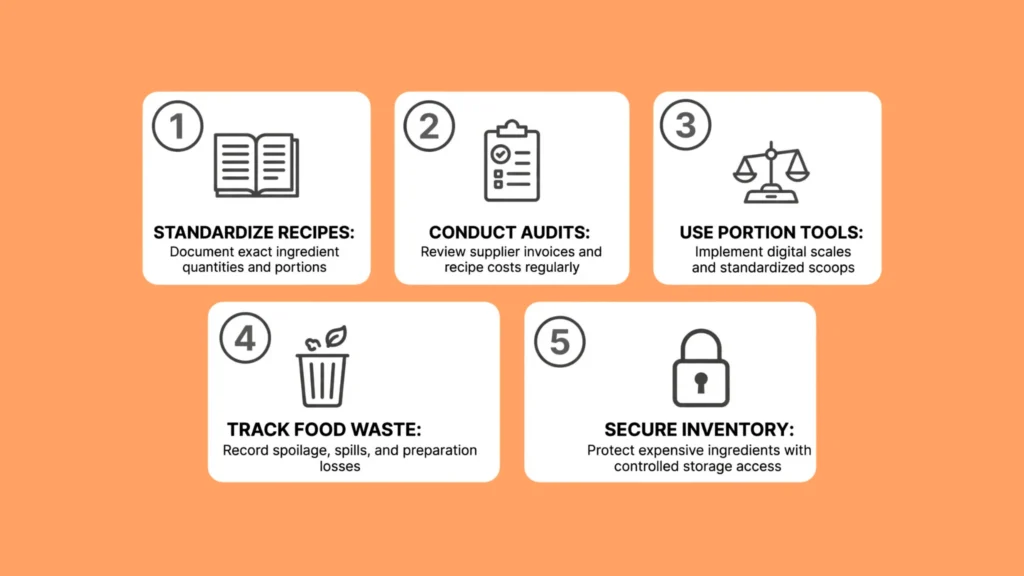
Implementing consistent operational standards prevents cost creep across daily kitchen shifts:
Standardize Kitchen Recipes: Document exact portion measurements, prep methods, and plating guides for every menu item to maintain consistent cost profiles.
Conduct Frequent Audits: Review vendor invoices weekly and update recipe cost cards quarterly to adjust for market price variations.
Use Precise Portion Tools: Equip prep lines with digital scales, standardized ladles, and uniform scoops to eliminate portion drift during service.
Track Kitchen Waste Daily: Maintain dedicated waste logs to record burnt items, spoiled produce, dropped plates, and prep trim.
Secure High-Value Storage: Lock walk-in freezers, liquor rooms, and dry storage holding expensive proteins, wine, and spirits to prevent internal loss.
Frequently Asked Questions
What is a good food cost percentage for a restaurant?
A target food cost percentage between 28% and 35% serves as a healthy baseline for traditional restaurant concepts. Fast-casual concepts may target lower ranges near 25%, whereas high-end steakhouses often run near 38% while relying on higher dollar margins.
How often should a kitchen calculate food cost percentage?
Operators should calculate overall food cost percentage weekly or monthly to track financial health against historical targets. Individual recipe costs should be audited quarterly or whenever vendor ingredient prices change significantly.
What is the difference between food cost percentage and gross profit margin?
Food cost percentage measures the proportion of total sales spent directly on raw food inventory. Gross profit margin represents the percentage of total sales remaining after subtracting total cost of goods sold from total revenue.
How do yield percentages alter plate cost calculations?
Yield percentages account for volume loss during prep and cooking. Adjusting recipe costs to reflect net usable weight ensures your plate cost calculation captures true ingredient expenses accurately.
Should kitchen labor costs be included in food cost percentage?
Standard food cost percentage formulas track raw ingredient costs exclusively. Labor expenses are tracked separately and combined with food costs under the total operating metric known as prime cost.
Final Thoughts
Mastering food cost percentage alongside practical menu engineering gives restaurant operators structured control over business profitability. Establishing precise recipe costs, measuring actual inventory performance against ideal targets, and structuring menu items based on profitability metrics creates a clear path toward sustainable financial performance in food service management.
About The Author